Most people don’t know that Google Sheets can be used to create dashboards. So if Google Sheets can be used to create dashboards, most of the time companies end up spending a significant portion of their finances on dashboards.
Creating dashboards in Google Sheets is one of the most valuable things small business owners can do with Sheets. Having the right and reliable dashboard to propel your company to new heights should boost your productivity significantly.
This article explains how to build a dashboard in Google Sheets and how to take advantage of the Google Sheets Dashboard Templates.
Looking for an annual budget dashboard template for Google Sheets? You can find the template in the template gallery by opening Google Sheets in your browser.
It even has its own template so you can follow the Google Sheets dashboard tutorial below. If you are looking for examples of Google Sheets dashboards, you will often find free sites where you can download dashboards Google Sheets online.
Other customized Google Sheets dashboard templates are also available for free. This template contains dummy data about shoe sales that you can replace with your own sales data.
Contents
What Is a Google Sheets Dashboard?
A project dashboard gives you a bird’s eye view of your entire project and helps you make future decisions based on the data you have. Most dashboards serve many purposes and are very flexible to use.
Dashboards consist of graphs and charts that make it easy for the viewer to understand the data and its representation. This data can also be displayed within a table, and dashboards typically have many colors, making it easier to define the data.
A good example of this is when a company can use a dashboard to view word trends for their employees. Achieving the same using a spreadsheet is very difficult. Because spreadsheets are very eye-straining and can skip a lot of data.
Simply put, dashboards make data easy to read by making it attractive and concise.
How to Create a Dashboard in Google Sheets
There are three main steps to follow when using a dashboard in Google Sheets.
- Import or collect data
- Parsing data (using formulas)
- Data visualization
The best way to create an easy-to-use dashboard is to put all the raw and parsed data on one sheet in your spreadsheet and all the visual data on the first sheet. You can also have multiple sheets of visual data, processed data, or raw data depending on your needs.

The easiest way to bring charts and tables into your dashboard is:
- highlight the cell in the datasheet where you want to visualize the data)

- Click the “Charts” button in the menu

- Decide what kind of chart you want
- When finished, highlight the chart and press Ctrl+x
- Go to your dashboard sheet and press Ctrl+v
- Then you can adjust the size of the sheet according to your needs
Let’s take a closer look at each of the three big steps to creating a Google Sheets dashboard.
Importing or Gathering Data
Unless you’re already using Google Sheets as your spreadsheet platform, you’ll need to have your raw data ready before you begin. You can also import it directly into your template to avoid building the entire dashboard. Here are some ways to import the data into your spreadsheet.
Using IMPORT Functions


Suppose you have access to the data you want to import into your spreadsheet. In that case, the IMPORT function can be effectively used according to the information format.
- IMPORTDATA: This can be used to import data in .csv or .tsv format.
- IMPORTRANGE: This can be used to import a specified range of cells from a particular spreadsheet.
- IMPORTFEED: can be used to import ATOM or RSS feeds
- IMPORTXML: You can use this to import data from several data types including HTML, TSV, CSV, XML, RSS and ATOM feeds. Basically this is a combination of IMPORTFEED, IMPORTHTML and IMPORTDATA expressions.
- IMPORTHTML: Can be used to import data from HTML pages.
The caveat here is that the data must be public for this to work.
Using Google Forms
Google Forms are generally a great way to store a lot of information in a spreadsheet. The IMPORTRANGE function makes it easy to import data from Google Forms into Google Sheets. You can also combine the IMPORTRANGE and QUERY functions for a more versatile workflow for filtering data before importing it into your dashboard.
If you create a new Google Form, you’ll need to create the Google Form, merge it into a spreadsheet, and store the data separately from the dashboard. This is a great way to protect your data from being overwritten.
Using an External Source via an Add On


This can be a bit tricky as it requires some technical knowledge. You can check out the API Connector addon for Google Sheets to connect your sheets using the API.
However, this can have drawbacks if the add-on developer makes updates that break the functionality of the dashboard. It’s no fun to start from scratch again.
After importing the data into Google Sheets, it’s time to organize the data.
Parsing Data
Now that you have your data in a sheet, it’s time to properly analyze and organize it. You may see jumbled numbers and irrelevant text. Still, with some time and patience, and some knowledge of using mathematical formulas, you can transform your raw data into clean, understandable data.
You don’t need to be a programmer or have a programming degree to do this work, but this step is a bit more complicated than the other two.
First, you need to know how formulas work and how you can manipulate data using these formulas. Introductory tutorials and courses can help with this.
For example, you can use the SUMIF formula to sum values in a particular column of a spreadsheet only if the cells in that column meet certain conditions.
Here are some functions to help you get started:
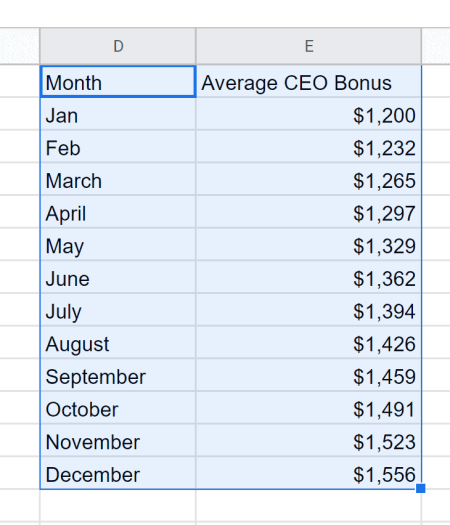
- AVERAGE: Used to find the average value of data in a particular column.