How to Switch X and Y Axis in Google Sheets [Easy Guide]
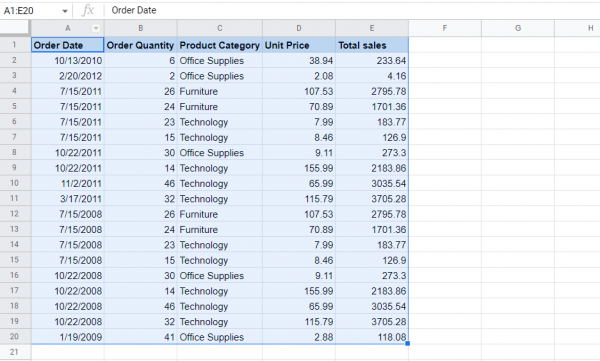
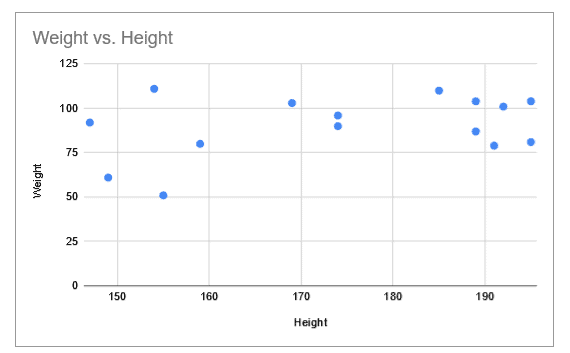
When you create a chart in Google Sheets, you will notice that the software automatically selects columns for each of the X and Y axes, trying to understand the data you have selected. However, the axis chosen does not always match what is required. In this tutorial, we’ll show you how to switch between x …
How to Switch X and Y Axis in Google Sheets [Easy Guide] Read More »