How to Make a Pareto Chart in Google Sheets [Step-by-Step]
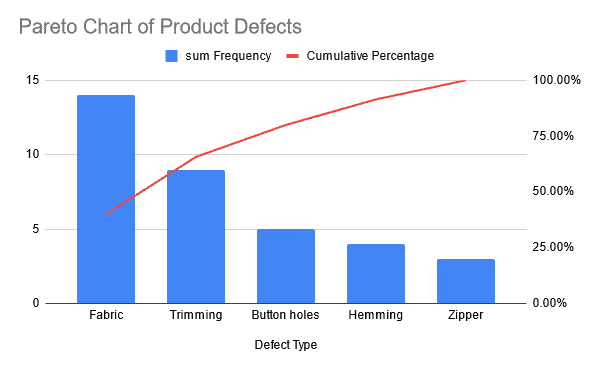
Pareto charts can be powerful visualization tools if you understand how to create and interpret them. They are great for visualizing causal phenomena and are used by many organizations to identify problem areas and room for growth. This tutorial will teach you everything you need to know about Pareto charts in Google Sheets. Learn what …
How to Make a Pareto Chart in Google Sheets [Step-by-Step] Read More »